This, which is from Wikipedia, goes into great depth about what the Mandelbrot Fractal is and how it functions. I have worked on this Fractal for many years now, and to this day I still find unique ways to further explore it. Although it always has a certain size, the complicated edge that you see, called its “frontier,” is always infinitely complex, meaning that you can zoom into the edge at any part of the frontier and you will see new patterns and forms that are both self-similar to a degree, and unique in a noticeable way. What is referred to as complex numbers have the y-axis a function of the square root of negative one, an imaginary number, referred to with the letter i. The x-axis is a function of real numbers. ~ Ben Gilberti
The Mandelbrot set is the set of complex numbers {\displaystyle c} for which the function {\displaystyle f_{c}(z)=z^{2}+c}
 does not diverge when iterated from {\displaystyle z=0}
 , i.e., for which the sequence {\displaystyle f_{c}(0)}
 , {\displaystyle f_{c}(f_{c}(0))}
 , etc., remains bounded in absolute value.

A zoom sequence illustrating the set of complex numbers termed the Mandelbrot set.
Its definition and name are due to Adrien Douady, in tribute to the mathematician Benoit Mandelbrot.[1] The set is connected to a Julia set, and related Julia sets produce similarly complex fractal shapes.
Mandelbrot set images may be created by sampling the complex numbers and determining, for each sample point {\displaystyle c}, whether the result of iterating the above function goes to infinity. Treating the real and imaginary parts of {\displaystyle c} as image coordinates {\displaystyle (x+yi)} on the complex plane, pixels may then be colored according to how rapidly the sequence {\displaystyle z_{n}^{2}+c}
 diverges, with the color 0 (black) usually used for points where the sequence does not diverge. If {\displaystyle c} is held constant and the initial value of {\displaystyle z}
 —denoted by {\displaystyle z_{0}}
 —is variable instead, one obtains the corresponding Julia set for each point {\displaystyle c} in the parameter space of the simple function.
Images of the Mandelbrot set exhibit an elaborate and infinitely complicated boundary that reveals progressively ever-finer recursive detail at increasing magnifications. The “style” of this repeating detail depends on the region of the set being examined. The set’s boundary also incorporates smaller versions of the main shape, so the fractal property of self-similarity applies to the entire set, and not just to its parts.
The Mandelbrot set has become popular outside mathematics both for its aesthetic appeal and as an example of a complex structure arising from the application of simple rules. It is one of the best-known examples of mathematical visualization.

The first published picture of the Mandelbrot set, by Robert W. Brooks and Peter Matelski in 1978
The Mandelbrot set has its place in complex dynamics, a field first investigated by the French mathematicians Pierre Fatou and Gaston Julia at the beginning of the 20th century. This fractal was first defined and drawn in 1978 by Robert W. Brooks and Peter Matelski as part of a study of Kleinian groups.[2] On 1 March 1980, at IBM‘s Thomas J. Watson Research Center in Yorktown Heights, New York, Benoit Mandelbrot first saw a visualization of the set.[3]
Mandelbrot studied the parameter space of quadratic polynomials in an article that appeared in 1980.[4] The mathematical study of the Mandelbrot set really began with work by the mathematicians Adrien Douady and John H. Hubbard,[1] who established many of its fundamental properties and named the set in honor of Mandelbrot.
The mathematicians Heinz-Otto Peitgen and Peter Richter became well known for promoting the set with photographs, books,[5] and an internationally touring exhibit of the German Goethe-Institut.[6][7]
The cover article of the August 1985 Scientific American introduced a wide audience to the algorithm for computing the Mandelbrot set. The cover featured an image created by Peitgen, et al.[8][9] The Mandelbrot set became prominent in the mid-1980s as a computer graphics demo, when personal computers became powerful enough to plot and display the set in high resolution.[10]
The work of Douady and Hubbard coincided with a huge increase in interest in complex dynamics and abstract mathematics, and the study of the Mandelbrot set has been a centerpiece of this field ever since. An exhaustive list of all the mathematicians who have contributed to the understanding of this set since then is beyond the scope of this article, but such a list would notably include Mikhail Lyubich,[11][12] Curt McMullen, John Milnor, Mitsuhiro Shishikura, and Jean-Christophe Yoccoz.
Formal definition
The Mandelbrot set is the set of values of c in the complex plane for which the orbit of 0 under iteration of the quadratic map
- {\displaystyle z_{n+1}=z_{n}^{2}+c}

remains bounded.[13] That is, a complex number c is part of the Mandelbrot set if, when starting with z0 = 0 and applying the iteration repeatedly, the absolute value of zn remains bounded however large n gets. This can also be represented as[14]
- {\displaystyle z_{n+1}=z_{n}^{2}+c,}

- {\displaystyle c\in M\iff \limsup _{n\to \infty }|z_{n+1}|\leq 2.}

For example, letting c = 1 gives the sequence 0, 1, 2, 5, 26, …, which tends to infinity. As this sequence is unbounded, 1 is not an element of the Mandelbrot set. On the other hand, c = −1 gives the sequence 0, −1, 0, −1, 0, …, which is bounded, and so −1 belongs to the Mandelbrot set.
The Mandelbrot set {\displaystyle M} is defined by a family of complex quadratic polynomials
- {\displaystyle P_{c}:\mathbb {C} \to \mathbb {C} }

given by
- {\displaystyle P_{c}:z\mapsto z^{2}+c,}

where {\displaystyle c} is a complex parameter. For each {\displaystyle c}, one considers the behavior of the sequence
- {\displaystyle (0,P_{c}(0),P_{c}(P_{c}(0)),P_{c}(P_{c}(P_{c}(0))),\ldots )}

obtained by iterating {\displaystyle P_{c}(z)} starting at critical point {\displaystyle z=0}, which either escapes to infinity or stays within a disk of some finite radius. The Mandelbrot set is defined as the set of all points {\displaystyle c} such that the above sequence does not escape to infinity.
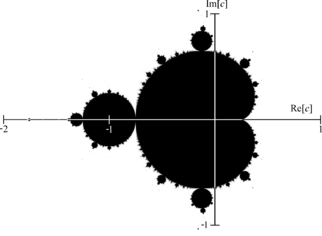
A mathematician’s depiction of the Mandelbrot set M. A point c is colored black if it belongs to the set, and white if not. Re[c] and Im[c] denote the real and imaginary parts of c, respectively.
More formally, if {\displaystyle P_{c}^{n}(z)} denotes the nth iterate of {\displaystyle P_{c}(z)} (i.e. {\displaystyle P_{c}(z)} composed with itself n times), the Mandelbrot set is the subset of the complex planegiven by
- {\displaystyle M=\left\{c\in \mathbb {C} :\exists s\in \mathbb {R} ,\forall n\in \mathbb {N} ,|P_{c}^{n}(0)|\leq s\right\}.}

As explained below, it is in fact possible to simplify this definition by taking {\displaystyle s=2} .
.
Mathematically, the Mandelbrot set is just a set of complex numbers. A given complex number c either belongs to M or it does not. A picture of the Mandelbrot set can be made by coloring all the points {\displaystyle c} that belong to M black, and all other points white. The more colorful pictures usually seen are generated by coloring points not in the set according to which term in the sequence {\displaystyle |P_{c}^{n}(0)|} is the first term with an absolute value greater than a certain cutoff value, usually 2. See the section on computer drawings below for more details.
The Mandelbrot set can also be defined as the connectedness locus of the family of polynomials {\displaystyle P_{c}(z)}. That is, it is the subset of the complex plane consisting of those parameters {\displaystyle c} for which the Julia set of {\displaystyle P_{c}} is connected.
{\displaystyle P_{c}^{n}(0)} is a polynomial in c and its leading terms settle down as n grows large enough. These terms are given by the Catalan numbers. The polynomials {\displaystyle P_{c}^{n}(0)} are bounded by the generating function for the Catalan numbers and tend to it as n goes to infinity.
Basic properties
The Mandelbrot set is a compact set, since it is closed and contained in the closed disk of radius 2 around the origin. More specifically, a point {\displaystyle c} belongs to the Mandelbrot set if and only if
- {\displaystyle |P_{c}^{n}(0)|\leq 2}
 for all {\displaystyle n\geq 0.}
In other words, if the absolute value of {\displaystyle P_{c}^{n}(0)} ever becomes larger than 2, the sequence will escape to infinity.
The intersection of {\displaystyle M} with the real axis is precisely the interval [−2, 1/4]. The parameters along this interval can be put in one-to-one correspondence with those of the real logistic family,
- {\displaystyle z\mapsto \lambda z(1-z),\quad \lambda \in [1,4].}
![{\displaystyle z\mapsto \lambda z(1-z),\quad \lambda \in [1,4].}](https://wikimedia.org/api/rest_v1/media/math/render/svg/37773e2176b9adc94c887c85ffa31898e8a140c5)
The correspondence is given by
- {\displaystyle c={\frac {\lambda }{2}}\left(1-{\frac {\lambda }{2}}\right).}

In fact, this gives a correspondence between the entire parameter space of the logistic family and that of the Mandelbrot set.
As of October 2012, the area of the Mandelbrot is estimated to be 1.5065918849 ± 0.0000000028.[15]
Douady and Hubbard have shown that the Mandelbrot set is connected. In fact, they constructed an explicit conformal isomorphism between the complement of the Mandelbrot set and the complement of the closed unit disk. Mandelbrot had originally conjectured that the Mandelbrot set is disconnected. This conjecture was based on computer pictures generated by programs that are unable to detect the thin filaments connecting different parts of {\displaystyle M}. Upon further experiments, he revised his conjecture, deciding that {\displaystyle M} should be connected.

External rays of wakes near the period 1 continent in the Mandelbrot set
The dynamical formula for the uniformisation of the complement of the Mandelbrot set, arising from Douady and Hubbard’s proof of the connectedness of {\displaystyle M}, gives rise to external rays of the Mandelbrot set. These rays can be used to study the Mandelbrot set in combinatorial terms and form the backbone of the Yoccoz parapuzzle.[16]
The boundary of the Mandelbrot set is exactly the bifurcation locus of the quadratic family; that is, the set of parameters {\displaystyle c} for which the dynamics changes abruptly under small changes of {\displaystyle c.} It can be constructed as the limit set of a sequence of plane algebraic curves, the Mandelbrot curves, of the general type known as polynomial lemniscates. The Mandelbrot curves are defined by setting p0 = z, pn+1 = pn2 + z, and then interpreting the set of points |pn(z)| = 2 in the complex plane as a curve in the real Cartesian plane of degree 2n+1 in x and y. These algebraic curves appear in images of the Mandelbrot set computed using the “escape time algorithm” mentioned below.
Other properties
Main cardioid and period bulbs

Periods of hyperbolic components
Upon looking at a picture of the Mandelbrot set, one immediately notices the large cardioid-shaped region in the center. This main cardioid is the region of parameters {\displaystyle c}for which {\displaystyle P_{c}} has an attracting fixed point. It consists of all parameters of the form
- {\displaystyle c={\frac {\mu }{2}}\left(1-{\frac {\mu }{2}}\right)}

for some {\displaystyle \mu } in the open unit disk.
To the left of the main cardioid, attached to it at the point {\displaystyle c=-3/4} , a circular-shaped bulb is visible. This bulb consists of those parameters {\displaystyle c} for which {\displaystyle P_{c}} has an attracting cycle of period 2. This set of parameters is an actual circle, namely that of radius 1/4 around −1.
Continue reading The Mandelbrot Set and Complex Numbers →